


The New 2025 Revenue Unicorn Playbook

AI is the hot story across the technology landscape right now, with private companies racing ahead on new use cases. But what about the public software incumbents? Our latest Revenue Unicorn analysis shows a different picture: growth is tapering even with AI tailwinds, though margins remain strong.
The pool of $1 Billion+ Revenue Unicorns continues to expand. Newer entrants take longer to get there, diluting the high-growth cohort metrics. At the same time, many of the strongest software companies opt to stay private longer, keeping them outside our public comparisons.
Is this divergence between private startups and public SaaS a temporary split or the start of a new era? Too early to call. What’s clear: Revenue Unicorn fundamentals still demonstrate what great software companies can achieve. The path to $1 Billion+ is repeatable -- we mapped it.
The Revenue Unicorn Playbook is a detailed map of how the most successful firms scale from $100 Million to $1 Billion in revenue. We use it both to guide founders in our portfolio and to shape how we deploy capital.
Below is a brief snapshot of what is inside the Playbook.
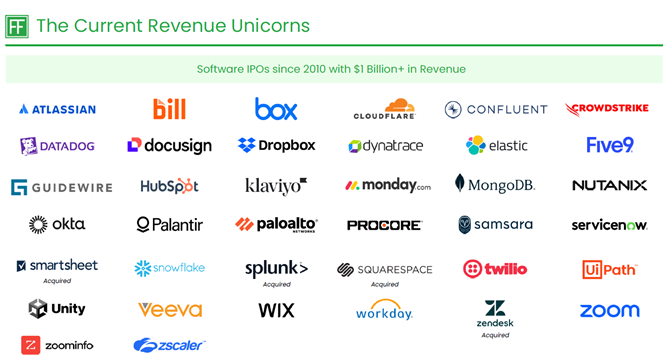
In addition to exceeding $1 Billion in annual revenue, the Revenue Unicorns all have core software business models, were founded in or after 2000, and had their IPO in 2010 or after. These characteristics ensure we have a contemporary era of business comparison.
Playbook from $100 Million to $1 Billion in Revenue
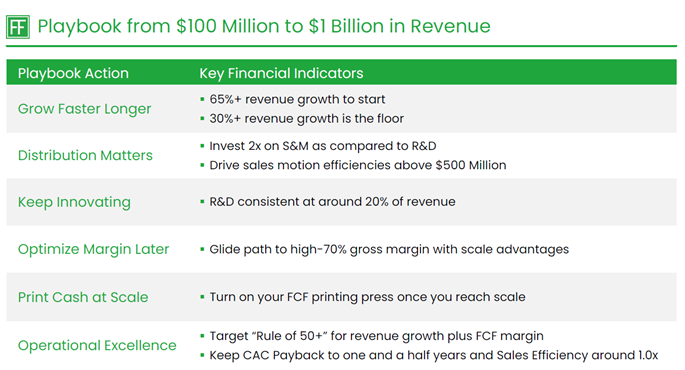
The Revenue Unicorns had durable growth on their journey to $1 Billion in revenue. They began their journey at $100 Million in annual revenue with 65%+ growth and never retreated below 30% growth as the floor. The Revenue Unicorns knew that a great product alone did not build a great business, and they invested 2x on S&M as compared to R&D. Their capital allocation was efficient and operationally superior. The Revenue Unicorns targeted 50%+ for the Rule of 40 SaaS metric while at the same time creating an efficient go-to-market motion.
Financial Metrics Across Revenue Ranges

The Revenue Unicorns consistently displayed strength in revenue growth to generate exemplary compounding. As the Revicorns scaled, their free cash flow began to build, displaying the operational leverage in their business models.
How Have Fundamentals Changed?

We’re now in the fourth annual version of the Revenue Unicorn Playbook. Compared to past fundamental reference points, the Revenue Unicorns have stayed similar in some metrics yet have changed in others.
Acceleration to $1 Billion Over Time

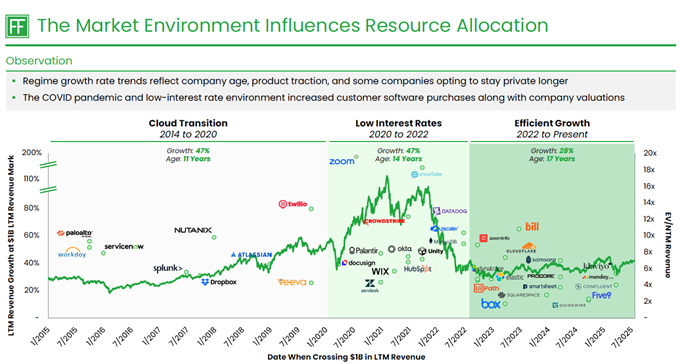
The time for an individual Revenue Unicorn to achieve $1 Billion in revenue continues to accelerate, yet at the same time the revenue growth rate for the median Revenue Unicorn when achieving $1 Billion in revenue has slowed. While at first counter-intuitive, an example can illustrate the concept. We only now see the fastest growing companies in the 2015 founding cohort become Revenue Unicorns within 10 years of life. In another 10 years there will almost certainly be more companies from this cohort surpassing $1 Billion in revenue, albeit the future new Revenue Unicorns will have run the race at a slower speed.
Benchmark Companies

What about all the other public software companies? The Benchmark companies encompass the same selection criteria as the Revicorns with the only difference being that the Benchmarks have not yet achieved the key characteristic of surpassing $1 Billion in annual revenue. All of the Benchmark companies are still on their journey to $1 Billion in revenue and offer a great comparison to the Revicorns.
Revenue Unicorns vs. Benchmark

When analyzing the financial fundamentals of the Revenue Unicorns and the Benchmarks there are two apparent differences. The first is that the Revenue Unicorns have much higher growth throughout their journey, never dropping below 34%. Conversely, the Benchmark median revenue growth never exceeds 34% in any revenue range.
The second line item to focus on is free cash flow margin between the Revenue Unicorns and the Benchmark. Interestingly, the Benchmark companies have just as good or better free cash flow margin across revenue ranges as compared to the Revenue Unicorns. Given the lower growth profile of the Benchmark companies and a higher cost of capital environment than in prior years, the public markets expect more cash flow stability earlier in a company’s lifecycle if growth is lower.
Operational Excellence: Rule of 50

Operational excellence is a shared trait amongst the Revenue Unicorns. The Revenue Unicorns Rule of 40 was consistently above 50%+ as they reached $1 Billion in revenue. In contrast, the Benchmark Rule of 40 was 30% between $250 Million and $750 Million in revenue.
Private Market Current and Potential Revenue Unicorns

Some of the best-in-class software companies are staying private for longer and achieving Revenue Unicorn status in the private markets. Here is a view of current and potential Revenue Unicorns that, once public, will be part of our analysis.
The complete Revenue Unicorn Playbook holds many additional learnings to help you build your company to $1 Billion in annual revenue.
About The Revenue Unicorn Playbook
The Revenue Unicorn Playbook is an analytical guide that explores the growth of public software companies from $100 Million to $1 Billion in revenue. The goal of the Playbook is to offer founders and company leaders a framework to examine their growth and investments as they scale.


.svg)
.svg)