


Revenue Unicorn Club: Tenable

Tenable Joins Revenue Unicorn Club
Congratulations to Tenable as it crosses $1 Billion in annual revenue and joins the software Revenue Unicorns!
Let's see what we can learn from Tenable's journey...
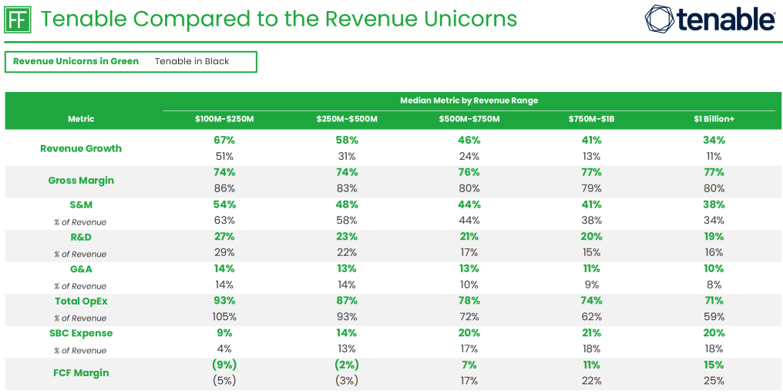
Revenue Growth

Tenable maintained a median revenue growth of 11% or higher on its path to $1 Billion in revenue. Procore and Wix exhibited a similar revenue growth trajectory on the path to $1 Billion in annual revenue.
Gross Margin
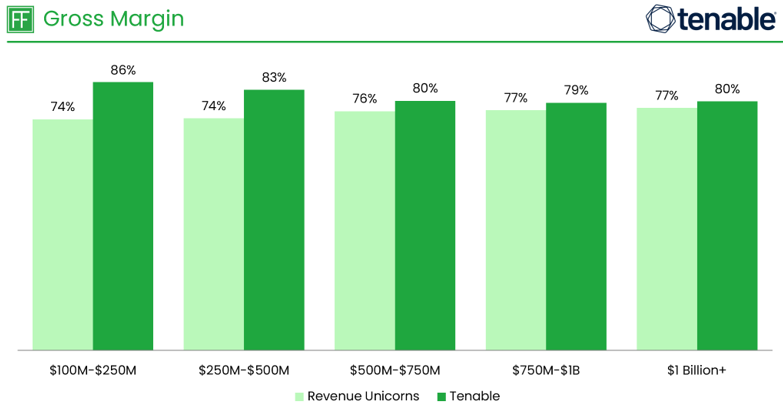
Tenable maintained 75%+ gross margins throughout its journey, higher than the Revenue Unicorn median across all revenue ranges and a sign of consistency in its operating model. Zscaler had a similar gross margin profile on the journey from $100 Million to $1 Billion+ in revenue.
Sales & Marketing

Tenable invested more than the Revenue Unicorn median in sales and marketing before reaching $500 Million in annual revenue, with improving efficiencies at scale. Tenable’s investment in sales and marketing as a percentage of revenue was similar to SentinelOne and Zoom on their respective paths to $1 Billion in annual revenue.
Research & Development

Tenable invested more heavily in research and development early in the Company’s lifecycle and later exhibited operating leverage, falling below the median after passing $250 Million in revenue. DocuSign and Box had similar research and development expense trends on their respective paths to $1 Billion in annual revenue.
General & Administrative
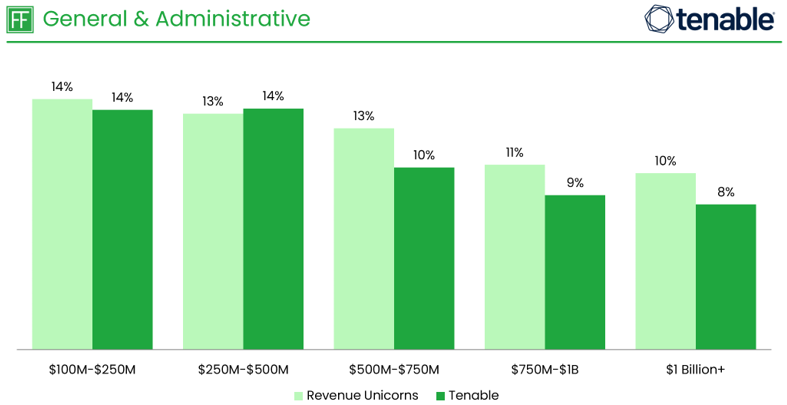
Tenable’s general and administrative expense was in line with the Revenue Unicorn median early and then fell below the median after passing $500 Million in revenue. CrowdStrike and HubSpot exhibited a similar general and administrative expense trend on their paths to $1 Billion in annual revenue.
Stock Based Compensation

Tenable had a lower SBC expense as a percentage of revenue compared to the Revenue Unicorn median across all revenue ranges on the journey to $1 Billion in annual revenue. Tenable’s SBC expense as a percentage of revenue increased with scale from 4% between $100 Million and $250 Million in revenue to 18% after passing $750 Million in revenue. When viewing SBC expense as a percentage of enterprise value, Tenable is at 5.3%, which is higher than the Revenue Unicorn median of 1.8% in the $1 Billion+ revenue range.
Free Cash Flow

Tenable’s free cash flow margin improved with scale, moving from negative free cash flow margins early in the Company’s lifecycle to positive free cash flow margins after passing $500 Million in revenue. Monday.com delivered a similar trend of improving free cash flow margin with business growth.
Time to Reach $1 Billion in Revenue
Tenable reached $1 Billion in revenue after 23.25 years. This is more than the median time of 13.38 years it took other Revenue Unicorns to reach the $1 Billion mark. Other Revenue Unicorns that took a similar amount of time to achieve the $1 Billion revenue threshold include Five9 (22.75 years) and Guidewire (22.75 years).
Other Revenue Unicorns founded around the same time as Tenable (2002 founding) include Atlassian (2002), Procore (2002), and Squarespace (2003). This set of companies took a median of 20.00 years to achieve $1 Billion in revenue (Atlassian at 16.00 years, Procore at 21.25 years, and Squarespace at 20.00 years).
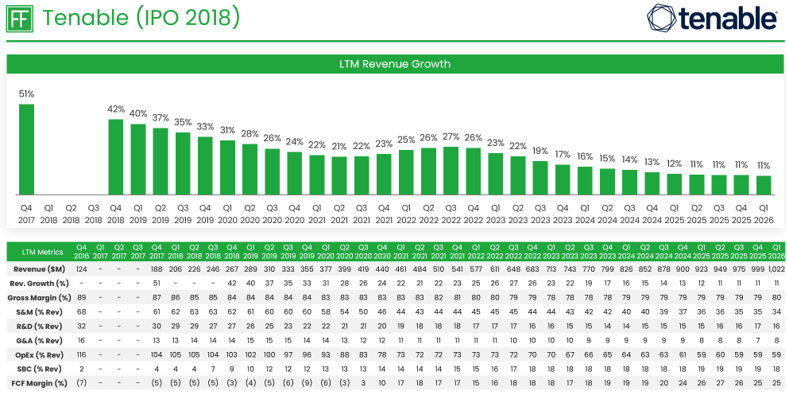
The Journey to $1 Billion in Revenue
For those of you that love data as much as we do, below is the full data set used for this analysis.
Again, congratulations to the Tenable team! Stay tuned for the next Revenue Unicorn update.
Note: The complete list of Revenue Unicorns used in the comparison can be found in the presentation here.
About Tenable
Tenable was founded in 2002 by Ron Gula, Jack Huffard, and Renaud Deraison. As per the Company’s materials, Tenable is the leading provider of exposure management solutions. Exposure management is an increasingly critical category that extends foundational vulnerability management capabilities to advance risk assessment and prioritization across the entire attack surface – from IT infrastructure and cloud environments to critical infrastructure and artificial intelligence (AI). Tenable unifies security visibility, insight and action across this attack surface, equipping modern organizations to quickly identify and close the cybersecurity gaps that erode business value, reputation and trust.
The Company reported $262 Million in first quarter revenue for the period ended March 31, 2026. Combined with results from the preceding quarters, this recent performance boosts Tenable across the $1 Billion in annual revenue threshold as measured on a last twelve month basis to become the latest software Revenue Unicorn.
About the Revenue Unicorn Playbook
The Revenue Unicorn Playbook is an analytical guide that explores the growth of public software companies from $100 Million to $1 Billion in revenue. The goal of the Playbook is to offer founders and company leaders a framework to examine their growth and investments as they scale.
You can find the original Revenue Unicorn article here and presentation here.


.svg)
.svg)